
Most “best static analysis tools” lists are vendor summaries in a trench coat: a feature bullet copied from each product page, no evidence anyone installed anything, and a table where every tool detects everything. That framing hides the only fact that matters when you are choosing — the tools disagree, sharply, about what counts as a bug.
So this guide starts from evidence. We wrote one 70-line C file containing eight deliberate defects, ran five open-source analyzers over it, and recorded exactly what each one caught and missed. Those results anchor the tool-by-tool reviews and the selection guide that follow. Five analyzers were installed and run for this article on Ubuntu 24.04: GCC 13.3 (-fanalyzer), Cppcheck 2.13.0, Clang-Tidy 18, Flawfinder 2.0.20, and Semgrep 1.172.0 — every output block below is captured verbatim from those runs. The seven commercial and hosted platforms covered later (SonarQube, Coverity, PVS-Studio, CodeQL, Snyk Code, Infer, PMD) were not run here; their entries describe licensing, language coverage, and positioning, verified against vendor documentation in July 2026 and dated as such.
What Is Static Code Analysis?
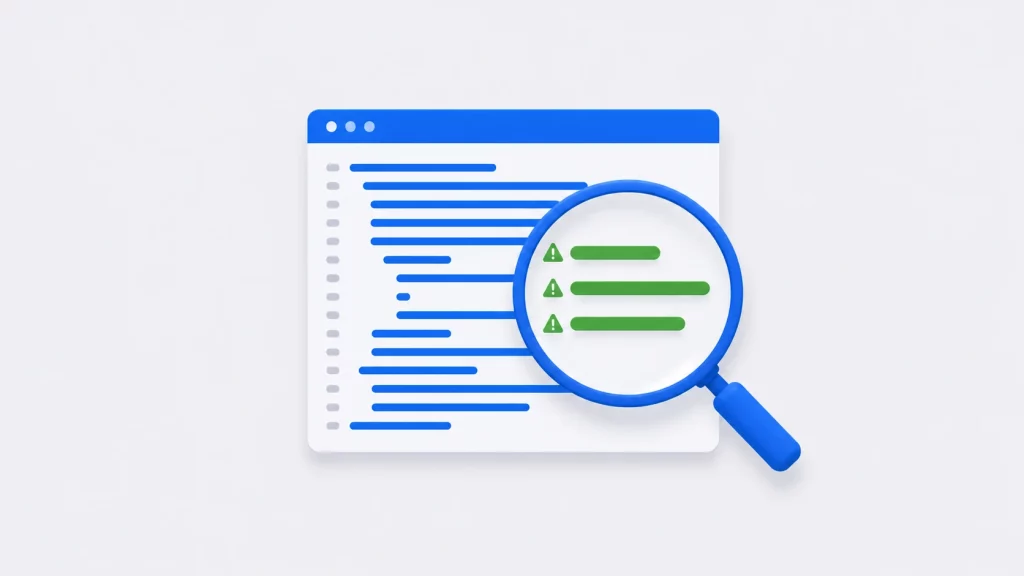
Static code analysis is the practice of examining source code for defects without executing it. Analyzers parse the code, build a model of its structure and data flow, and report constructs that are provably wrong or highly likely to be wrong — buffer overflows, null dereferences, memory leaks, race conditions, and injection risks. Because no test case is required, static analysis finds bugs on code paths your test suite never reaches.
The counterpart is dynamic analysis, which runs the program and observes real behavior (sanitizers, fuzzers, profilers). Neither replaces the other: static analysis reasons about all paths but must approximate, so it produces false positives; dynamic analysis reports only what actually happened, so it produces false negatives on untested paths. Serious codebases run both. For the precise semantics of what compilers can prove about a program, cppreference’s undefined behavior page is the reference worth bookmarking.
The term SAST (Static Application Security Testing) is often used interchangeably, but it is narrower: SAST means static analysis aimed specifically at security defects, and it is the label vendors use when selling to security teams rather than to developers.
The Four Layers of Static Analysis
“Static analysis tool” covers four genuinely different technologies. Choosing well starts with knowing which layer you are shopping in, because a layer-2 tool will never find a layer-3 bug no matter how much you pay for it.
Layer 1 — Formatters and linters. clang-format, ESLint’s stylistic rules, gofmt. These enforce consistency and catch typo-grade mistakes. They have no model of program behavior and no bug-finding intent. Valuable, but not what this article is about; the GNU coding standards and the Linux kernel coding style are the documents these tools mechanize.
Layer 2 — Pattern scanners. Flawfinder, Semgrep’s default rules, most regex-based security scanners. They match code shapes: “a call to strcpy“, “a hardcoded password-looking string”. Fast, trivially extensible, language-agnostic — and blind to context, because they do not track what values actually flow into that call.
Layer 3 — Dataflow and symbolic analyzers. GCC’s -fanalyzer, Cppcheck, Clang’s static analyzer, Coverity, CodeQL, PVS-Studio, Infer. These build a model of execution paths and track values along them, which is how a tool can say “this pointer is null on this specific path“. Most real defects live here, and so does most of the industry’s money.
Layer 4 — Formal verification. Frama-C, Astrée, and Infer’s separation-logic core. These aim to prove the absence of an entire defect class rather than hunt for instances. The payoff is certainty; the cost is annotation effort and expertise, which is why adoption concentrates in avionics, automotive, and medical devices.
The Bake-Off: Five Analyzers, One File, Eight Bugs
Here is the differentiator no vendor page will give you. The test file contains eight defects — one per function, each a distinct class:
/* vulnerable.c - eight deliberate defects, one per function. */
#include <stdio.h>
#include <stdlib.h>
#include <string.h>

/* 1. Stack buffer overflow: no bound on the copy. */
void copy_name(const char *input) {
    char name[16];
    strcpy(name, input);
    printf("%s\n", name);
}

/* 2. Memory leak: buffer is never freed. */
void leak_buffer(void) {
    char *buf = malloc(64);
    snprintf(buf, 64, "temporary");
}

/* 3. Null dereference: malloc result used without a check. */
void unchecked_alloc(size_t n) {
    int *values = malloc(n * sizeof *values);
    values[0] = 42;
    free(values);
}

/* 4. Use after free. */
void use_after_free(void) {
    char *p = malloc(32);
    free(p);
    strcpy(p, "gone");
}

/* 5. Division by zero. */
int average(const int *data, int count) {
    int total = 0;
    for (int i = 0; i < count; i++)
        total += data[i];
    return total / count;
}

/* 6. Uninitialized read. */
int uninitialized(void) {
    int result;
    return result * 2;
}

/* 7. Off-by-one: writes one element past the end. */
void fill_array(void) {
    int arr[10];
    for (int i = 0; i <= 10; i++)
        arr[i] = i;
}

/* 8. Resource leak: file handle never closed on the early return. */
int read_config(const char *path) {
    FILE *f = fopen(path, "r");
    char line[128];
    if (fgets(line, sizeof line, f) == NULL)
        return -1;
    fclose(f);
    return 0;
}
Results
| Defect | GCC -fanalyzer | Cppcheck 2.13 | Clang-Tidy 18 | Flawfinder 2.0.20 |
|---|---|---|---|---|
| 1. Stack buffer overflow | Yes | Yes | Yes | Yes |
| 2. Memory leak (never freed) | No | Yes | No | No |
| 3. Null dereference | Yes | No | No | No |
| 4. Use after free | Yes | No | Yes | No |
| 5. Division by zero | No | No | No | No |
| 6. Uninitialized read | Yes | Yes | Yes | No |
| 7. Off-by-one array write | No | Yes | No | No |
| 8. FILE resource leak | Yes | Yes | No | No |
| Total found (of 8) | 5 | 5 | 3 | 1 |
No single tool found more than five of eight. GCC and Cppcheck each found five — but different fives. Run together they catch seven of the eight defects, which is the single most useful finding in this article: on C and C++, these two free tools are complementary rather than redundant, and running both costs nothing.
Here is GCC’s output, unedited:
vulnerable.c: In function 'copy_name':
vulnerable.c:11:5: warning: stack-based buffer overflow [CWE-121] [-Wanalyzer-out-of-bounds]
vulnerable.c:11:5: note: write of 19 bytes to beyond the end of 'name'
vulnerable.c:11:5: note: valid subscripts for 'name' are '[0]' to '[15]'
vulnerable.c: In function 'unchecked_alloc':
vulnerable.c:24:15: warning: dereference of possibly-NULL 'values' [CWE-690] [-Wanalyzer-possible-null-dereference]
vulnerable.c: In function 'use_after_free':
vulnerable.c:32:5: warning: pointer 'p' used after 'free' [-Wuse-after-free]
vulnerable.c: In function 'read_config':
vulnerable.c:60:9: warning: use of possibly-NULL 'f' where non-null expected [CWE-690] [-Wanalyzer-possible-null-argument]
vulnerable.c:61:16: warning: leak of FILE 'f' [CWE-775] [-Wanalyzer-file-leak]
Note the CWE identifiers. GCC tags findings with the same taxonomy commercial SAST vendors use in their compliance reports — a detail that matters if anyone ever asks you to map findings to a security standard.
And Cppcheck on the same file:
vulnerable.c:53:12: error: Array 'arr[10]' accessed at index 10, which is out of bounds. [arrayIndexOutOfBounds]
vulnerable.c:11:12: error: Buffer is accessed out of bounds: name [bufferAccessOutOfBounds]
vulnerable.c:19:1: error: Memory leak: buf [memleak]
vulnerable.c:61:9: error: Resource leak: f [resourceLeak]
vulnerable.c:46:12: error: Uninitialized variable: result [uninitvar]
The one nobody caught, and why
Every tool missed the division by zero — and the reason is instructive rather than damning. average() is never called in the file, so no analyzer can see an argument of 0 reaching count. Add a single call and re-run, and the picture changes:
vulnerable_called.c:40:18: error: Division by zero. [zerodiv]That is Cppcheck, now finding it. GCC and Clang-Tidy still do not. The lesson generalizes: static analysis quality depends on how much of the call graph the tool can see. Analyzing a file in isolation is the weakest mode; whole-program or cross-translation-unit analysis is where commercial tools earn their price, and it is exactly the capability most free tools gate or omit.
Comparison Table: 12 Static Analysis Tools
| Tool | Type | Languages | License / cost model | CI + IDE |
|---|---|---|---|---|
| Cppcheck | Dataflow | C, C++ | Open source (GPL); paid Premium adds MISRA | CLI, most C++ IDEs |
| Clang-Tidy | Dataflow + lint | C, C++, Objective-C | Open source (Apache 2.0 w/ LLVM exception) | CLI, clangd in any LSP editor |
GCC -fanalyzer | Dataflow | C (C++ experimental) | Free; already in your compiler | Compiler flag — no new tooling |
| PVS-Studio | Dataflow | C, C++, C#, Java | Commercial; free for open source, MVPs, security researchers | CLI, VS, Rider, IntelliJ, SonarQube |
| Black Duck Coverity | Dataflow | 20+ | Commercial (quote); free Coverity Scan for open source | CLI, major CI systems |
| SonarQube | Dataflow + quality | 30+ | Free Community Build; paid Server/Cloud editions | CLI, all major CI, SonarLint IDE |
| CodeQL | Query-based dataflow | 10+ | Free on public GitHub repos; private repos need GitHub Code Security | GitHub Actions, CLI |
| Semgrep | Pattern + dataflow | 30+ | Open source CE (LGPL-2.1); free cloud tier; paid Team plan | CLI, GitHub/GitLab CI, IDE plugins |
| Infer | Formal (separation logic) | Java, C, C++, Objective-C | Open source (MIT), Meta-maintained; no paid tier | CLI; wraps your build |
| PMD | AST rules | Java, Apex, JS, XML, more | Open source (BSD-style) | CLI, Maven, Gradle, Eclipse, IntelliJ |
| ESLint | Lint + rules | JavaScript, TypeScript | Open source (MIT) | CLI, every JS toolchain, all major editors |
| Snyk Code | Dataflow (SAST) | 10+ | Commercial; free tier with monthly test limits | CLI, IDE plugins, Git integrations |
Pricing and licensing verified against vendor documentation in July 2026; see the honesty section near the end for what these figures do and do not cover.
The Free and Open-Source Tools
1. GCC -fanalyzer — the analyzer you already have
Added in GCC 10 and materially improved in every release since, -fanalyzer performs path-sensitive analysis during compilation. It found five of our eight defects with no installation, no configuration, and no new CI step.
gcc -std=c11 -Wall -Wextra -fanalyzer -c yourfile.cPros: zero adoption cost; CWE-tagged diagnostics; no separate tool to keep in sync with your compiler version. Cons: C-focused — C++ support remains experimental; noticeably slower builds on large translation units; fewer checks than a dedicated commercial engine.
Verdict: if you compile with GCC and are not passing this flag, you are leaving free bug detection on the table. Start here before evaluating anything else. (Clang users have the equivalent in clang --analyze; the C++ compilers guide covers the trade-offs between the two toolchains.)
2. Cppcheck — the best free C/C++ bug-finder
Cppcheck deliberately does not duplicate the compiler. It targets undefined behavior and dangerous constructs the compiler will not flag, and it parses code with non-standard syntax, which makes it unusually useful on embedded projects. In our test it was the only tool to catch the off-by-one write and the plain memory leak.
cppcheck --enable=warning,style,performance,portability src/Pros: genuinely low false-positive rate — the project treats false positives as bugs; runs fully offline with no license server; strong embedded-code tolerance. Cons: missed use-after-free and null-dereference in our test; MISRA, CERT, and AUTOSAR compliance checking requires the commercial Cppcheck Premium.
3. Clang-Tidy — the modernizer
Clang-Tidy blends a linter, a bug-finder, and a refactoring engine. Its distinguishing feature is --fix, which rewrites your source in place for a large fraction of its checks, and its modernize-* family that migrates legacy C++ toward current idioms.
clang-tidy src/*.cpp --checks='clang-analyzer-*,bugprone-*,modernize-*' -- -std=c++20Pros: auto-fix is a real time-saver on large legacy migrations; deep C++ knowledge; integrates with clangd so findings appear as you type. Cons: lowest raw detection score in our test (three of eight); needs a compile_commands.json for accurate results on real projects; check selection is genuinely fiddly.
4. Semgrep — rules that look like the code they match
Semgrep occupies the space between grep and a full dataflow engine. A rule is YAML in which the pattern is written in the target language’s own syntax, so a developer can write a useful rule in minutes rather than learning a query language.
rules:
  - id: unbounded-strcpy
    pattern: strcpy($DST, $SRC)
    message: >-
      Unbounded strcpy into a fixed-size buffer. Use snprintf() or strlcpy()
      with an explicit destination size.
    languages: [c]
    severity: ERROR
That rule, run against our test file, produces:
❯❯❱ unbounded-strcpy
      Unbounded strcpy into a fixed-size buffer. Use snprintf() or strlcpy()
      with an explicit destination size.
       11┆ strcpy(name, input);
Pros: the fastest path from “we keep making this mistake” to “CI blocks this mistake”; 30+ languages; open-source CLI under LGPL-2.1 with a free cloud tier for small teams. Cons: the open-source engine analyzes a single file at a time — cross-file dataflow is a paid Pro capability; naive rules over-report, as ours did, and need tuning.
5. CodeQL — code as a database
CodeQL compiles your codebase into a relational database and lets you query it. That inversion is powerful: a security researcher can express “find every path from user input to this sink” as a query and run it across thousands of repositories.
Pros: genuine cross-file taint tracking; free on public GitHub repositories; the query library is open source and community-extended. Cons: QL is a real language with a real learning curve; private repositories require a GitHub Code Security subscription; effectively assumes you are on GitHub.
6. Infer — proof-oriented analysis from Meta
Infer applies separation logic to reason about memory and concurrency, and it runs by wrapping your existing build (infer run -- make). Meta runs it on its own codebase at scale, which is a meaningful signal about robustness.
Pros: MIT-licensed with no paid tier; strong on null-dereference and resource-leak classes; analyzes what your build actually compiles. Cons: OCaml toolchain to install; support is GitHub issues, with no commercial SLA available; language coverage narrower than the big platforms.
7. PMD — the Java workhorse
PMD applies rules to the abstract syntax tree and ships a custom rule designer for teams that want to encode house conventions. It also detects copy-pasted code via its CPD component.
Pros: mature Java ecosystem integration (Maven, Gradle, all major IDEs); XML rulesets are straightforward to author and review. Cons: oriented toward style and common flaws rather than deep dataflow security defects; JVM memory tuning is often required on large codebases.
8. ESLint — the JavaScript and TypeScript default
ESLint is not primarily a security tool, but with eslint-plugin-security and typed linting enabled it becomes a credible first line of defense for JS/TS — and it is already installed in essentially every JavaScript project.
Pros: universal adoption; enormous plugin ecosystem; auto-fix on a large share of rules. Cons: layer 1-to-2 by default; security value depends entirely on which plugins and type-aware rules you enable.
The Commercial Tools
9. SonarQube — the code-quality platform
SonarQube is the most widely deployed option in this list, and its scope is broader than bug-finding: quality gates, technical-debt tracking, coverage integration, and a dashboard that non-engineers actually look at.
Two naming changes matter in 2026. The free self-hosted edition is now called Community Build (formerly Community Edition), and SonarCloud is now SonarQube Cloud. Sonar does not publish list prices for the self-hosted Server editions — Developer, Enterprise, and Data Center are priced per instance per year by lines of code, and quoted by sales. SonarQube Cloud does publish a free tier: up to 50,000 lines of code and five users.
Pros: best-in-class reporting and trend tracking; branch and pull-request analysis on paid tiers; SonarLint surfaces the same rules in the IDE. Cons: self-hosting is real infrastructure work; the most useful features (branch analysis, PR decoration, C/C++ analysis) sit behind paid tiers; opaque Server pricing makes budgeting hard until you talk to sales.
10. PVS-Studio — deep C/C++/C#/Java analysis
PVS-Studio has an unusually strong reputation for diagnostic depth in C and C++, backed by detailed per-rule documentation and mappings to CWE, MISRA, AUTOSAR, and SEI CERT.
Freshness note that most articles have wrong: PVS-Studio changed its free licensing in April 2026. The long-standing option of using the analyzer free by inserting special comments in your source has been discontinued, and the student and teacher program is suspended pending new terms. Free licensing remains available for open-source projects, Microsoft MVPs, and public security researchers. If you read elsewhere that you can get PVS-Studio free by adding a comment header, that advice is now out of date.
Pros: exceptional C/C++ diagnostic coverage; support answered by the engineers who wrote the analyzer; standards-compliance mappings out of the box. Cons: commercial pricing is quote-only; narrow language range (C, C++, C#, Java); the free-tier landscape just got tighter.
11. Black Duck Coverity — the enterprise standard
The biggest naming change in this space: Coverity is no longer a Synopsys product. Synopsys divested its Software Integrity Group in 2024, and on 1 October 2024 the business became independent as Black Duck Software, Inc. Coverity Static Analysis is now a Black Duck product. Any article still calling it “Synopsys Coverity” has not been updated in two years.
Pros: very deep interprocedural analysis; the compliance reporting and audit trail regulated industries require; Coverity Scan remains free for open-source projects. Cons: enterprise pricing and enterprise procurement; heavyweight to deploy and tune; overkill for small teams.
12. Snyk Code — developer-first security scanning
Snyk Code is the SAST component of a platform whose center of gravity is dependency and container security. Its appeal is workflow: findings arrive in the IDE and on pull requests rather than in a separate console.
Pros: fast scans; strong Git provider integrations; sits alongside Snyk’s dependency scanning, which is where a large share of real vulnerabilities actually originate. Cons: free tier is capped by monthly test limits; deepest value requires buying into the wider platform; less configurable than rule-authoring tools like Semgrep.
AI-Assisted Code Review: Where It Actually Fits
The category that did not exist when this article was first written is AI reviewers — GitHub Copilot code review, CodeRabbit, and a growing field of others — which post natural-language comments on pull requests.
They are genuinely good at things traditional analyzers cannot do: explaining why a change is risky, spotting missing test coverage for new branches, catching naming and API-design inconsistencies, and summarizing a large diff for a human reviewer. They are correspondingly weak where deterministic tools are strong. An LLM does not prove that a pointer is null on a specific path; it predicts that the code looks like code where a pointer is null. That distinction matters when the finding is the only thing standing between you and a CVE.
The practical arrangement in 2026 is not either-or. Deterministic analyzers gate the merge — they are reproducible, so a build either passes or fails. AI review advises the human, adding the contextual judgment that a rule engine has no way to encode. Teams that replace the first with the second trade a guarantee for a suggestion.
How to Choose: A Decision Guide
| Situation | Start with | Add when you need it |
|---|---|---|
| Solo developer / side project | GCC -fanalyzer or clang --analyze, plus Cppcheck | Semgrep CE for house rules |
| Small team, open source | Cppcheck + Clang-Tidy in CI; CodeQL free on public repos | Coverity Scan (free for OSS); PVS-Studio OSS license |
| Startup, private repos | SonarQube Community Build or Cloud free tier | Semgrep or Snyk when security review becomes a requirement |
| Mid-size engineering org | SonarQube paid edition for quality gates and dashboards | Semgrep Team or GitHub Code Security for cross-file taint analysis |
| Enterprise / regulated | Black Duck Coverity or PVS-Studio for compliance mapping | Formal verification (Frama-C, Astrée) for certified components |
| Safety-critical (DO-178C, ISO 26262) | Certified toolchain — Coverity, PVS-Studio, or Astrée | Independent tool qualification evidence |
Four rules generalize across every row:
- Turn on the analyzer you already own first. Compiler-integrated analysis costs nothing and, in our test, matched a dedicated tool.
- Run two complementary tools, not one. GCC plus Cppcheck found seven of eight defects; neither found more than five alone.
- Fail the build on new findings only. Legacy codebases produce thousands of warnings on day one. Baseline them, then block anything new — this is the single most important adoption decision, and the one teams most often get wrong.
- Measure false positives before you buy. Run the trial on your code, not the vendor’s demo. A tool your developers learn to ignore is worse than no tool, because it converts a quality signal into noise.
Key Takeaways
- No single analyzer is sufficient. In our eight-defect test, the best tools found five; running GCC’s analyzer and Cppcheck together found seven.
- The free tier is far better than most teams assume.
-fanalyzerand Cppcheck together cost nothing and outperformed a naive single-tool setup. - Know which layer you are buying. Pattern scanners cannot find dataflow bugs; only layer-3 and layer-4 tools reason about execution paths.
- Call-graph visibility drives detection. The division-by-zero was invisible until a call site existed — the reason cross-file analysis is the feature commercial tools charge for.
- Two vendor facts date most competing articles: Coverity is now a Black Duck product, not Synopsys, and PVS-Studio’s free-by-comment licensing ended in April 2026.
- AI review complements, not replaces. Deterministic tools gate merges; AI reviewers advise humans.
Frequently Asked Questions
How We Know (and What We Can’t)
Detection results in this article come from tools installed and run on Ubuntu 24.04 in July 2026, on the source file printed above; the outputs are captured verbatim, not paraphrased. That covers GCC 13.3, Cppcheck 2.13.0, Clang-Tidy 18, Flawfinder 2.0.20, and Semgrep 1.172.0.
The commercial and hosted tools — SonarQube, Coverity, PVS-Studio, CodeQL, Snyk Code, Infer, PMD, ESLint — were not benchmarked here. Their sections describe licensing, language coverage, and positioning taken from vendor documentation in July 2026, and should be read as such rather than as measured performance.
Two limits are worth stating plainly. First, an eight-defect file is a probe, not a benchmark: it shows that these tools differ and roughly how, but real-world detection depends on codebase size, build configuration, and rule tuning. Second, pricing moves. Sonar and Black Duck quote Server and enterprise pricing through sales rather than publishing it, and PVS-Studio’s free terms changed within the last four months. Treat every figure here as a July 2026 snapshot and confirm with the vendor before committing budget.
Conclusion
The uncomfortable truth in the results above is that tool selection matters less than tool adoption. A team running two free analyzers on every commit, with new findings failing the build, will ship fewer defects than a team that bought the most expensive platform in this list and let its warnings accumulate into background noise.
Static analysis has also stopped being a standalone purchase. It now sits inside a pipeline alongside version control discipline, review culture, and automated testing — the parts of engineering practice covered across our DevOps section. Start with the analyzer already built into your compiler, add a second tool that fails differently from the first, and revisit this decision when your codebase or your compliance obligations change.