This article will list the top 10 source code analysis and code review tools that I have used throughout my 13+ years career in the software development field. These tools are also known as Static Application Security Testing (SAST) Tools and can help analyze source code or compiled programs.
Most developers use static analysis tools that are plugged into their development environments, such as Visual Studio, Eclipse, or other IDE consoles. However, there are times when you need to run these tools in a stand-alone environment and generate analysis reports.
Table of Contents
- How to choose the correct Code Analysis tool?
- Code Review Tool Evaluation Criteria
- SonarQube
- DeepScan
- PMD – Source Code Analyzer
- Microsoft Application Inspector
- Scitools – Understand
- Source{d}
- DeepSource
- CAST
- WhiteSource
- Snyk
- PVS-Studio
- Summary
How to choose the correct Code Analysis tool?
Generally, we choose code analysis tools based on code review requirements and metrics required for the subjective analysis. Code analysis is done to measure the code maintainability and analyze the application security. Some of the metrics and their categories are as below:
Code Maintainability
- Technical Debt – Implied cost of additional rework to do in future.
- Code Smells – Duplicate code, uncovered code and too complex code.
- Code Standard
- Adherence to Design Principles
- Adherence to Coding standards
- Comments and Documentation
Application Security
- Static Application Security Testing (SAST)
- Buffer Overflows
- Encryption
- Resource Leaks
- Open Source Security
- License Management
- Vulnerability Analysis
Code Review Tool Evaluation Criteria
I use the following criteria when finalizing a code review tool. Generally, we can determine this from the tool’s features listed on the vendor website. It is best to study the reviews on independent review websites such as Trustpilot and review general discussion about the tool on different technical forums such as StackOverflow etc.
The following criteria will help you better in deciding what is the best static code analysis tool for your use case.
- Programming Languages Support
- Code Review Performance
- Standards Compliance Checking
- Ease of Use – Rule Writing, defining code policies
- Offerings – Free/Open Source vs. Commercial
- Reporting – High-level or drilled down report
- Scalability – Process Millions of lines of code
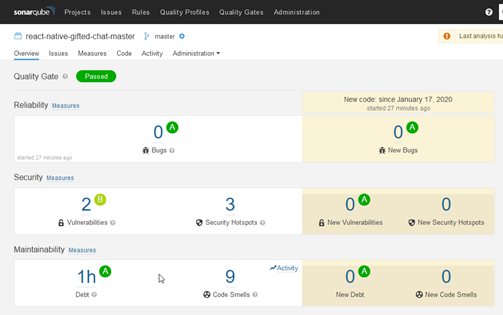
SonarQube
SonarQube houses a community of 200K+ dev teams and the best tool for Code Quality and Code Security. It helps developers write cleaner and safer code with the help of thousands of automated Static Code Analysis rules.
Pros
- Directly connects to GitHub repository or use CLI.
- It provides a Web-based UI with detailed reporting functionality and instance configuration.
- SonarQube supports 29 different programming languages.
- The default scan report covers most of the basic metrics.
Cons
- Writing new Rules is fairly complex as writing a new plugin for the tool.
- Some advanced functions are available in the commercial version i.e., Swift support and Branch analysis.
DeepScan
DeepScan is an advanced static analysis tool, which supports JavaScript, TypeScript, React, and Vue.js. DeepScan has two options to run code analysis i.e. directly connecting to GitHub Repository or having an extension installed in IDE i.e. Visual Studio, Node.js Package, etc. In both cases, code is copied onto the DeepScan server for analysis.
Pros
- Directly connects to GitHub repository.
- It has built-in React Rules.
Cons
- For direction connection, the user has to be the owner of the GitHub repository.
- Code is copied onto DeepScan server first however; local server installation is available in commercial version only.
- Free version is only available for Open Source projects hosted on GitHub.
PMD – Source Code Analyzer
This free open source tool works on the Windows, Mac OS and Linux. I used Windows Chocolatey to install and run on the sample product i.e. an open source chat application.
It supports many programming languages such as Java, JSP, C, C++, C#, Fortran and PHP source code.
Pros
- It can be used directly on code base in file system.
- It has a nice custom rule designer to write rules using ruleset XML.
- It can be integrated with other analyzer tools and IDEs.
- Plugins are available for Maven, Gradle, Eclipse, NetBeans, JBuilder, JDeveloper and IntelliJ IDEA.
Cons
- It is geared towards code style checking and common programming flaws only.
- Resource hungry and I am not able to even run a single category or rule on 32GB memory with Intel Core i8 processor. Tried to allocate 16GB memory to heap but still throws: Exception in thread “main” java.lang.OutOfMemoryError: Java heap space.
- Scan reports are available in textual format i.e. very simple html, text, XML with basic information.
Microsoft Application Inspector
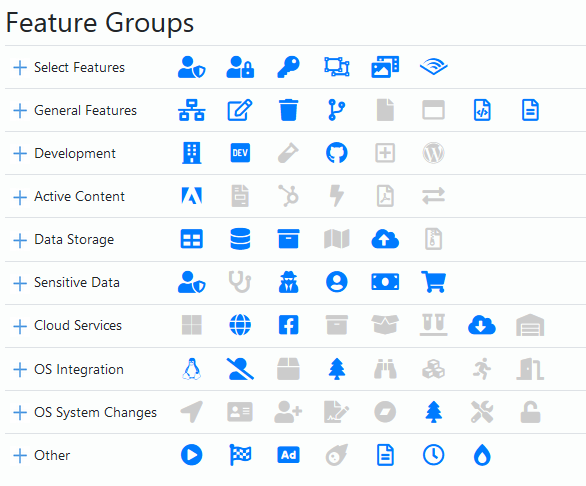
MS Application Inspector seems to be very basic code analysis tools and rule checking is based on RegEx patterns. It is useful for scenarios to identify signatures and patterns in code, such as using a specific library or reference. It is very easy to setup/configure and run locally. This is an excellent tool to run on product source code to quickly look at the product environment and technologies used. It can further identify application features and could be modified to report missing features or something we really wanted to see in the software application.
Pros
- Very simple and easy to setup and write rules
- Excellent tool for identifying application features i.e. Build System is present, Use of OpenSource libraries etc.
Cons
- Feature checking is based on RegEx signature checking of these features.
- Number of false negative and false positive are higher in my scans.
Scitools – Understand
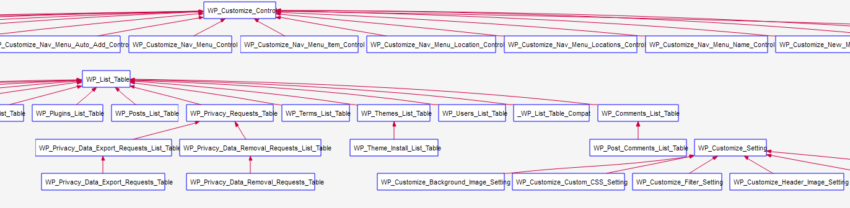
Understand is a static analysis tool mainly aimed for legacy code visualization and metrics. It performs impact analysis and visualize large and complex legacy code.
It can generate UML class diagrams from code, Architectural dependencies, Cyclomatic Complexity charts, and tons of other visualizations.
Pros
- Excellent tool for code visualization and generating architectural diagrams from code.
- Simple, easy to run UI and minimal configurations required.
- Generates complex reports, annotates codes and shows many other metrics.
- Understands and analyzes HTML and CSS too.
- Identifies complex code/entities/file, large class/functions etc.
- Provides visual dependency analysis and further drill down the dependencies.
- It supports many programming languages including C/C++, Java, PHP, Assembly, Python, Typescript and C#.
Cons
- It slows down when generating reports i.e. it took over an hour to compile reports for WordPress software.
Source{d}
It analyses source code in a language-agnostic way and organizes code as a dataset. It can also retrieve and store the git history of the code as a dataset. It stores analysis in a database but does not provide any mechanism to analyze it further by creating reports or dashboards.
Pros
- It can extract information from the evolution, commits, and metadata of codebase and from GitHub.
- Another advantage is that it can analyze source code branches and history.
Cons
- Difficult to install and configure as it requires Docker with a bunch of other dependencies to install.
- Data is stored in DB and no reporting component is available so rely on SQL queries to retrieve data and analyze it.
DeepSource
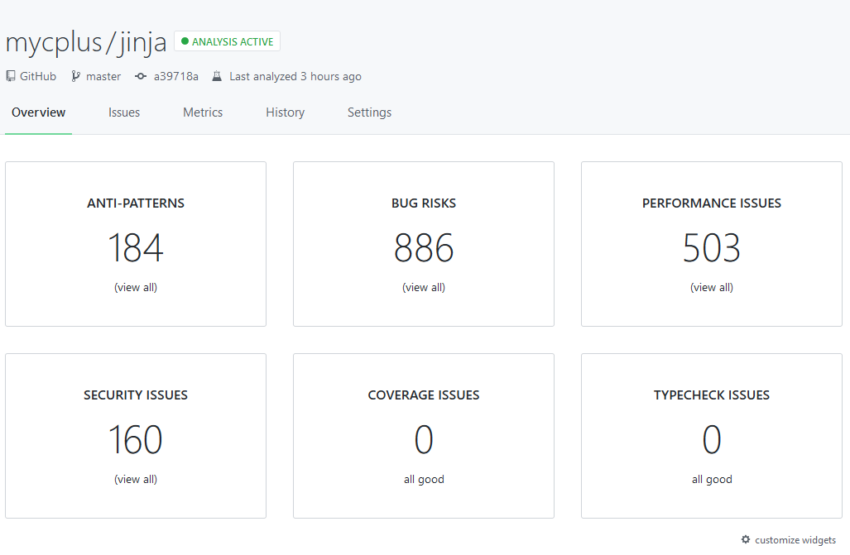
DeepSource works with GitHub and GitLab and Bitbucket only. It finds issues like bug risks, anti-patterns, performance optimizations and security vulnerabilities and provide options to auto fix certain issues. It requires explicit permissions in the respective source code public and private repositories. It supports Javacript, Ruby, Go, Java, Rust and PHP while it works with Docker and Terraform.
Pros
- It can every pull-request that from the repository.
- Automatically formats the source code as per the standards.
- It can reduce the maintenance cost of setting up CLI tools on CI and help automating quality practices.
Cons
- It requires to install all dependencies in order to get a full picture of source code for in-depth analysis.
- This tool also requires read/write access to the repository and writes the configuration files into the repository for analysis.
CAST
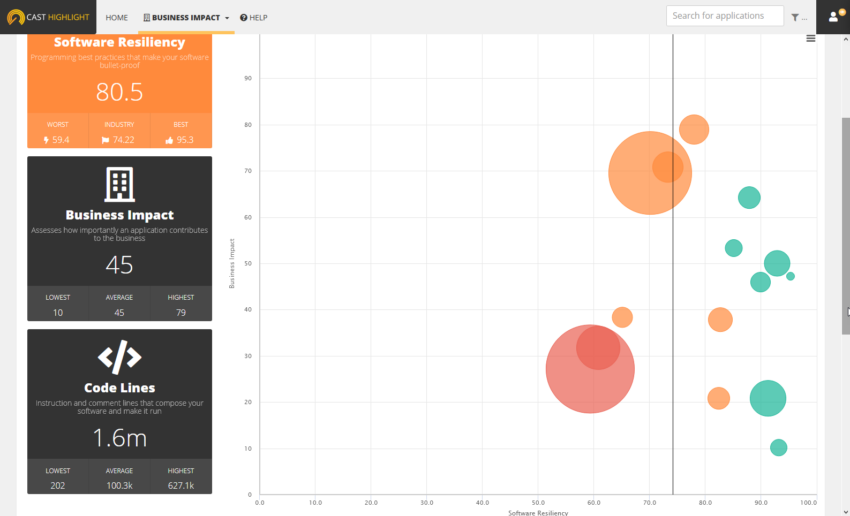
CAST Highlight tool uses user surveys, scan agents to gather data regarding the software application, and uploads the results into the cloud infrastructure. It does not transmit any source code into the cloud servers. It supports many programming languages for detection, sizing metrics and software composition analysis. Some of them are: Java, COBOL, C/C++, C#, Objective-C, PHP, JavaScript, TypeScript, Python, JSP, Visual Basic, VB.Net, Ruby, Scala, Go, Groovy, Fortran, R, Kotlin, SWIFT.
Pros
- Extensive reporting capability and organized in different dashboards.
- Show customizable charts, tables with tons of different metrics.
- It can list third party components used in the application and risks associated with each component i.e. vulnerabilities, dependencies and license compliance.
Cons
- Suitable for larger code bases and multiple tech stacks used.
- Reports reliability is a big question as it relies on user surveys to some extent.
WhiteSource
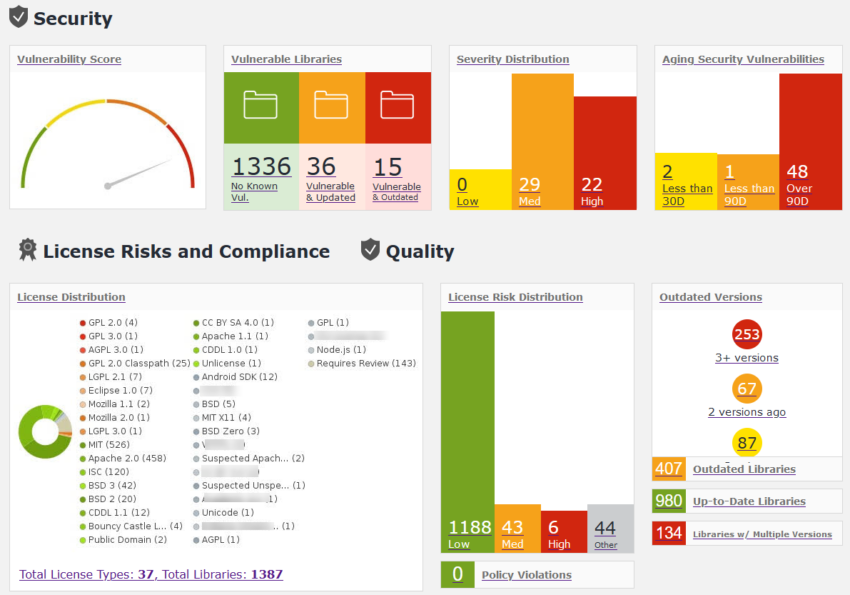
WhiteSource is an open source security and license management tool, which can identify a list of open source components used in your application along with their known vulnerabilities. It can also enforce license policies throughout the software development lifecycle. It can scan software applications written in a wide range of programming languages. Some of them are C, C++, C#, Go, Java, JavaScript, php, python, swift, and more.
Pros
- Extensive reporting capability and organized in different dashboards.
- Show customizable charts, tables with tons of different metrics.
- It can list all sorts of open source components used in the application and risks associated with each component i.e. vulnerabilities, dependencies and license compliance.
- Code scanner tool is easy to configure by modifying a simple configuration file.
- It can integrate with the DevOps pipeline to detect vulnerable open source libraries in real-time.
Cons
- Suitable only for open source scans and license compliance.
- The dashboard UI and UX are problematic and sometime does not work as expected.
Snyk
Snyk is a security intelligence tool that can find vulnerabilities in application source code, open source libraries and containers. It can easily integrate with existing IDEs, workflows and supports wide range of programming languages. Some of the popular programming languages supported by Snyk are Java, JavaScript, .NET, Python, Golang, Swift, Objective-C, Ruby, Scala, PHP and Elixir.
Pros
- It provides integration support with GitHub, GitLab, Bitbucket, and Azure Repos.
- It is easy to setup and provides detailed reporting both in UI as well as CLI tool.
Cons
- The documentation needs improvement and needs to have a community where developers can communicate.
PVS-Studio
A tool is designed to find errors and potential vulnerabilities in code. PVS-Studio is a paid B2B solution. However, there are several ways to get a free license of the static code analyzer. The work of PVS-Studio is based on various approaches and processes for deeper code analysis, that allow to find serious errors that go undetected after the code review process, unit testing, etc.
Pros
- Easy to download, install and try out.
- Expert technical support. Over the years, PVS-Studio has built a team of proven code analysis experts. Clients get support directly from the analyzer developers.
- A detailed documentation of each diagnostic rule with the examples of incorrect and correct code.
- Easy-to-use analyzer reports. The analyzer reports are available in Html, Xml, Csv, Txt, Json, CompileError, TaskList, TeamCity formats. The report generator itself is posted on GitHub for custom modifications.
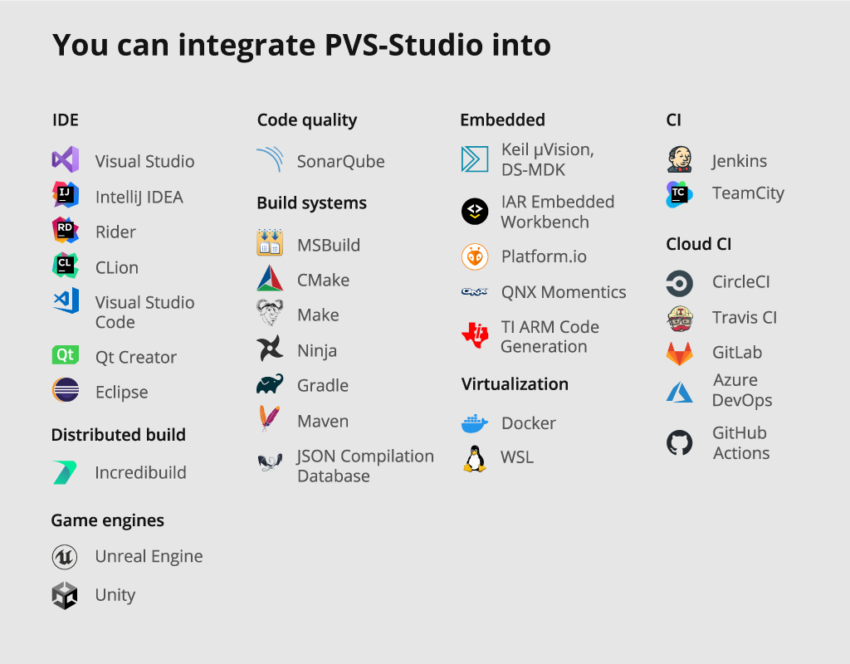
- Plugins. To enhance interaction with the analyzer, PVS-Studio provides plugins for Visual Studio, IntelliJ IDEA, Rider, SonarQube, Jenkins, and other similar products.
- The analyzer matches warnings to CWE, SEI CERT, MISRA, AUTOSAR, OWASP.
Cons
- Supports only a few programming languages: C, C++, C#, Java.
Summary
There are hundreds of static code analysis and security testing tools are available online. However, in this article, I have listed only the tools that I have personally used in difference scenarios and use cases. There are many other tools, which you can use, such as GitClear which analyzes existing Git data to find actionable opportunities. One of my favorites is Hercules tool which gains insights from Git repository history. It provides insights into burn downs by repositories, files or people, added vs modified LoC over time and efforts of developers over time.